

This solution is an example of a Model with maps of targets and indicators of the bank with their decomposition to the level of branches and offices, and if necessary, to the level of management.
Operation in begins with a general summary of the form with the map of branches of the bank. The indicator near the city shows the average performance of all branches of the bank located in the city. Upon reaching the average performance of all bank branches in the city at 95%, the indicator will turn green. From 80% to 95% – yellow and below 80% – red. Border interest in the system can be changed.
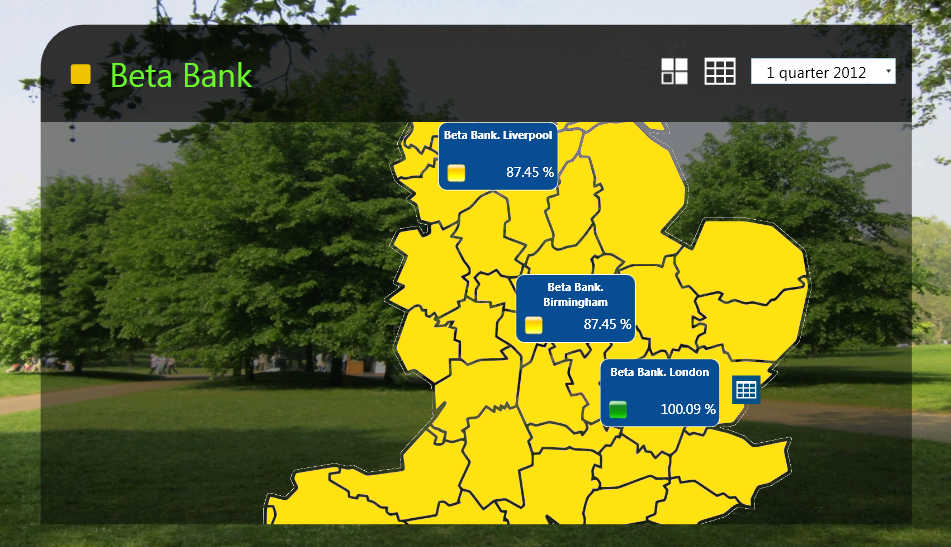
Fig. 1. Consolidated view. Cities with branches of the bank.
When you click on the city it shows the map of the city with branches shown. Color coding is also used as in the previous form, but reflecting the average performance of a particular branch of the bank.
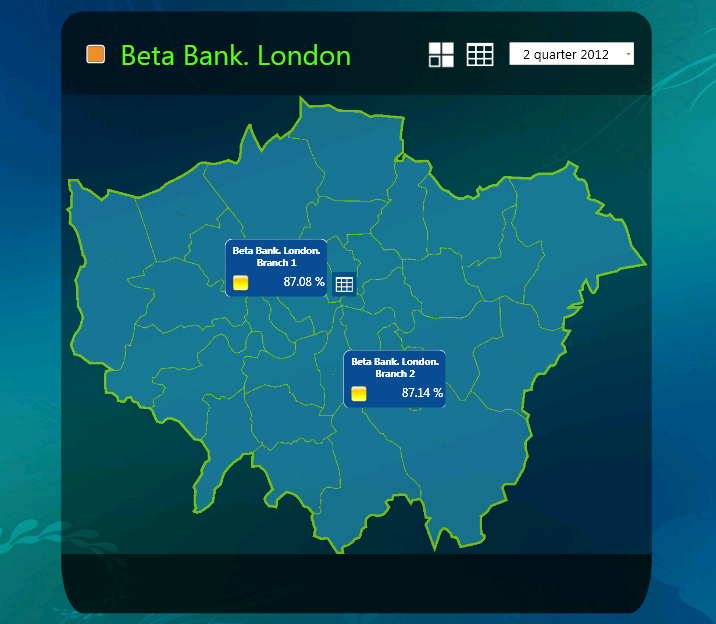 Fig. 2. Consolidated view. Branches of the bank on the city map.
When you click on the branch of the bank it proceeds to map the strategic objectives of the Bank. Each strategic objective is assessed as a percentage and also has a color display, based on the average performance of all indicators, the implementation of which is estimated to achieve a strategic goal. The arrows between the strategic objectives reflect a cause-and-effect relationship of the goals or their correlation.
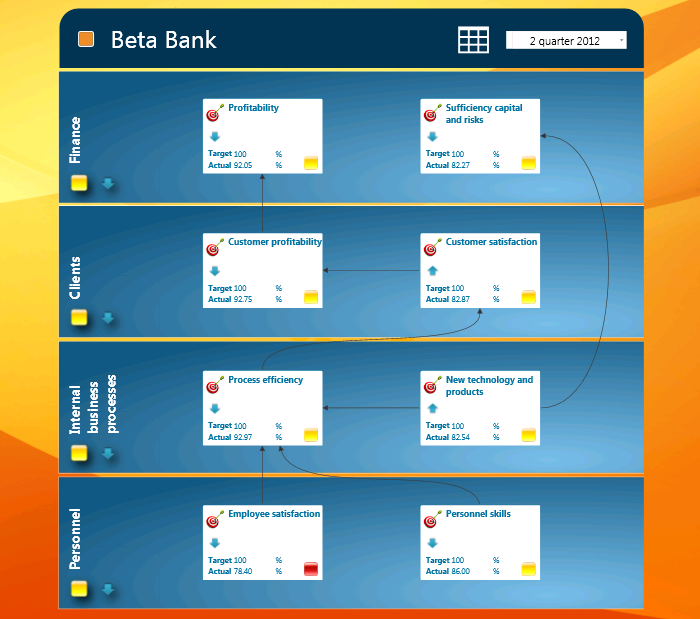
Fig. 3. The Strategic Map of the bank.
Strategic objectives calculation can be displayed by Fig. 4. The strategic goal of “Customer Satisfaction” is evaluated through implementation of two KPIs – “Satisfaction Index” and “Customer Loyalty.” Fulfillment of the targets is multiplied by the weight of the indicators and the results sum up. The actual value of the Strategic Objective is the average value of the two measures. Plan for the purpose is set to 100%.
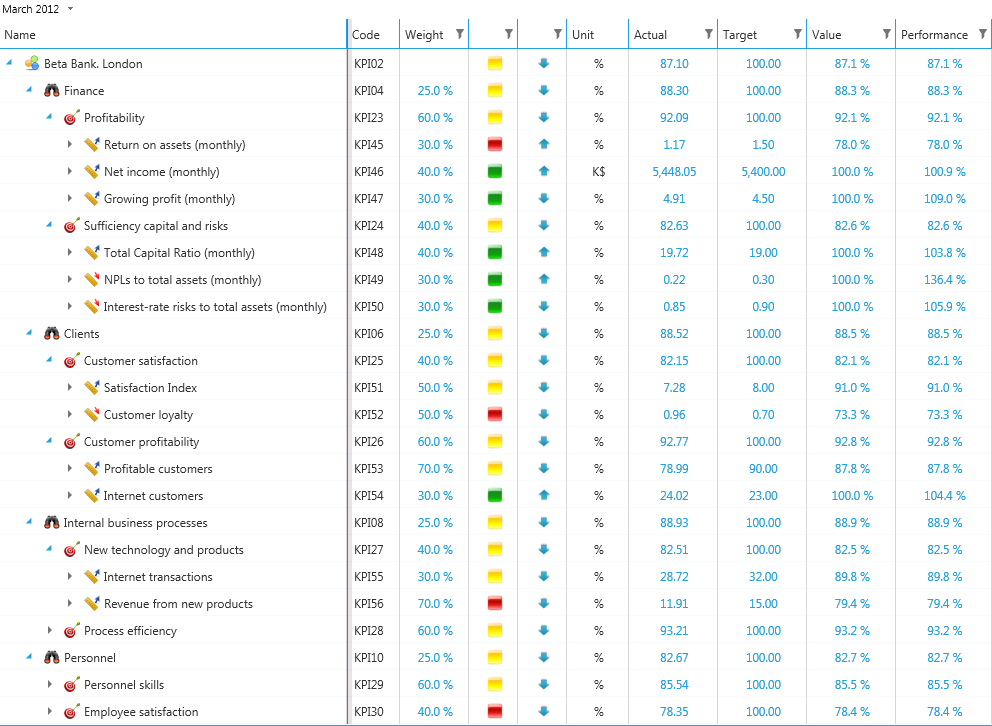
Fig. 4. The calculation of strategic goals of the bank on the basis of performance KPI.
As it is shown in Fig. 4 strategic objectives and performance indicators are measured quarterly. But some indicators may have different frequency. For example, for the Finance group a period of data storage – a month. To bring value to the values for the months by quarter, in terms of prescribed formula for automatic grouping of data for the quarters. Only then calculated quarterly performance of the purposes of the Finance group. If the Pictures are not absolute values and relative, in this case, the grouping of values at the city and the whole bank is made by taking the average value.
Each branch in the system has its own strategic map with targets and KPI indicators. The consolidation of the values to the level of the city and in the end at the level of the bank is produced by indicators. Consider the example in Fig. 5. The example shows that the rate of “net income” for all branches in Moscow is calculated by summing the indicators of “Net Income” on the branches of Moscow. Thus, each component in the system is automatically clustered at the city level, and only then the average performance of all branches in the city is calculated. The same principle is used to assess the overall performance of all the bank branches in all cities. But the value of the indicator “Net income” is summarized for all cities.
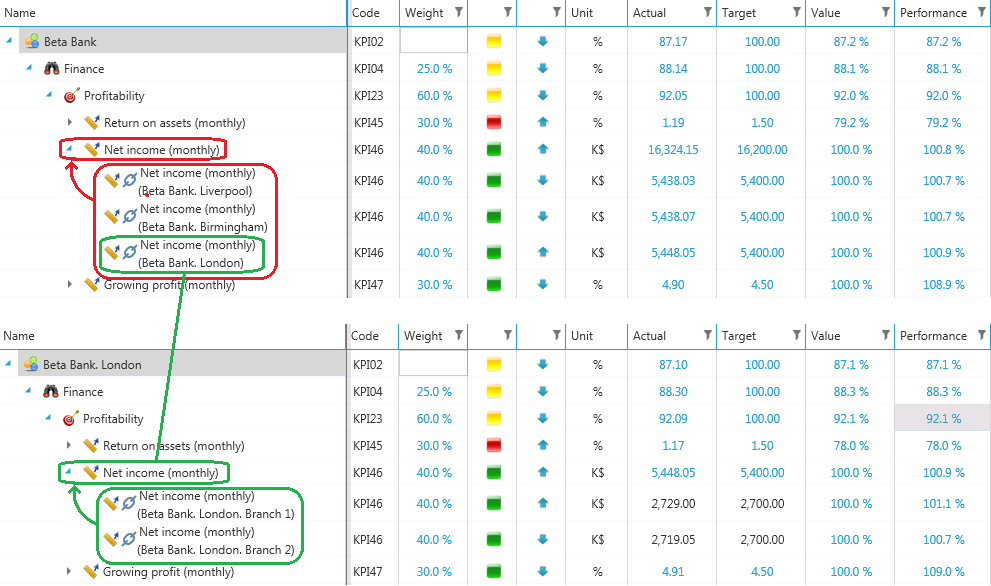
Fig. 5. Consolidation of KPI.
Each component of the system internally stores the values for all periods with specified intervals. The example in Pic. 6 shows that the values are stored every month, but it is also possible to group them by and a year or the entire history. The most common rules for grouping values is the Sum or Average. But you can also set your algorithm grouping, such as minimum, maximum, first or last value, etc.
If necessary, the frequency of data storage can be changed to any other. The values stored in the indicators can be entered manually through a web browser (shown in gray) if the user has rights to change data. Here are stored and calculated data (shown in blue).
In the system, each indicator has laid the necessary algorithms for calculating the % of completion, valuation, indicators, trend, etc. In most cases there is no need to set up their own algorithms to calculate these parameters. If you want to enter new indicators, it is enough to create them on the basis of ready-made prototypes from the existing performance indicators library. In this case the addition of the indicator is reduced to a few mouse clicks and the subsequent initial data input for the reporting periods.
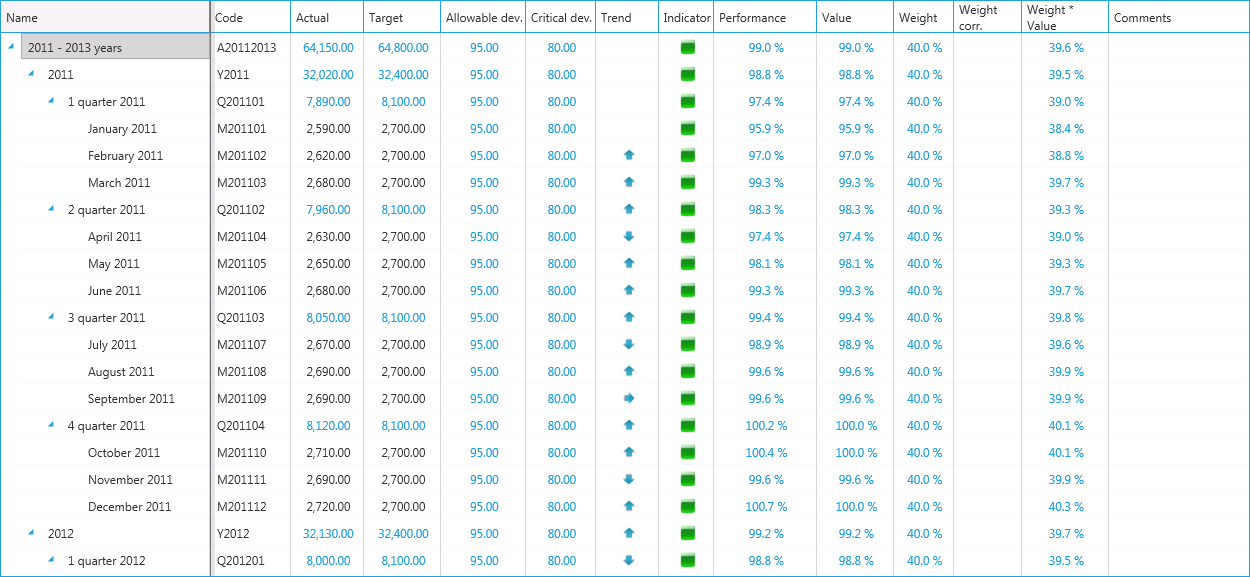
Fig. 6. Source data of KPI by periods.
Each indicator has one or more graphical representations of data for all periods in itself. These representations are useful for displaying various kinds of diagrams. In this example, to display the Targets zoning diagrams are used where you can see the color of the targets for the periods. For indicators it is convenient to use the Plan-and-Fact comparison chart.
These charts are only examples. If necessary, you can customize your view of the chart, and it will be automatically displayed in each record.
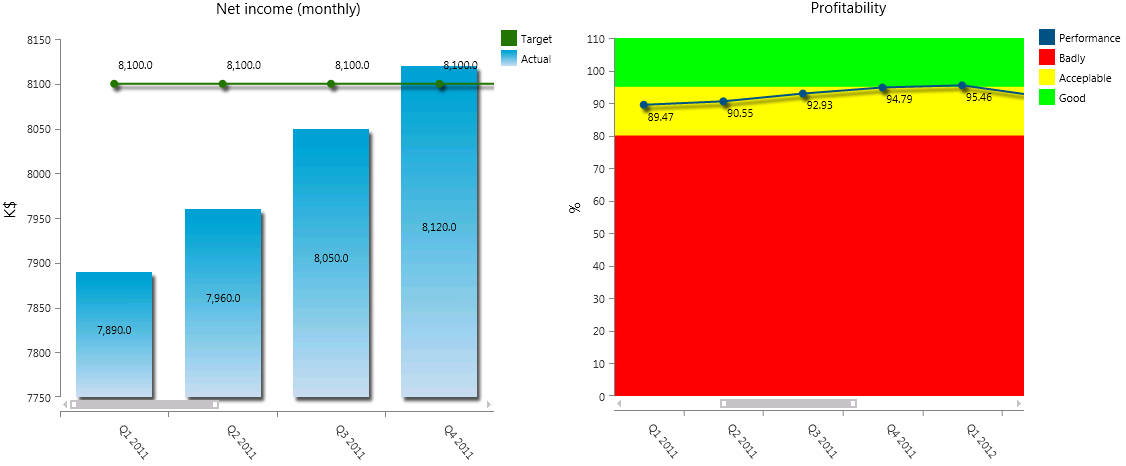
Fig. 7. Examples of the charts.
By analogy to other decisions on the KPI Suite system, in this solution it is also possible to group indicators for which performance heads of all levels are responsible and to make the calculation of performance of all indicators for which the head is responsible. Results of an assessment can be used for the motivation system for the employees.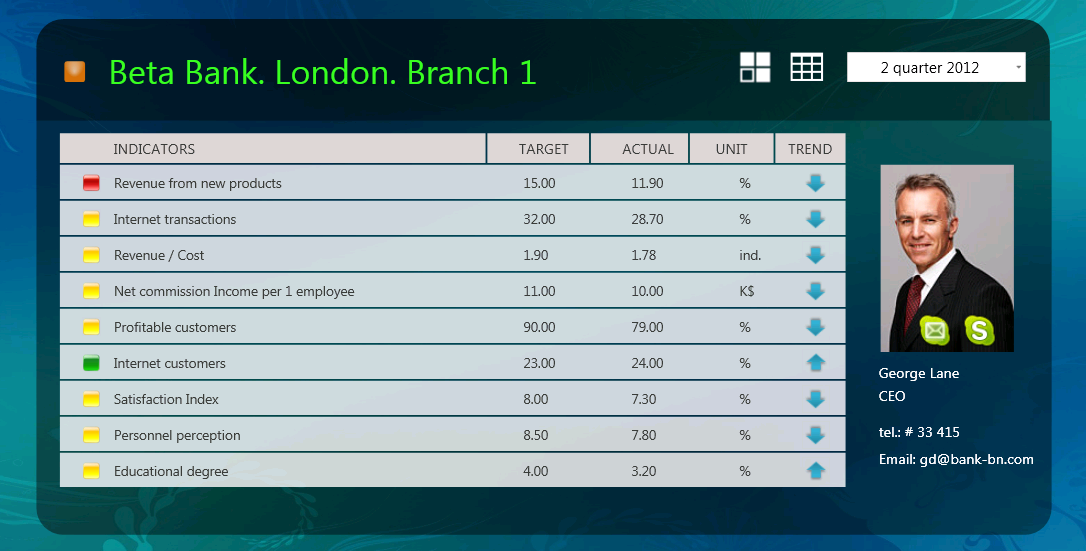
Fig. 8. Example of employee’s card with the measurement of performance of KPIs.
Once the entire structure of objectives and indicators of the bank by division was built, the issue of automatically downloading data from the accounting systems of each branch arises. Accounting systems may be different, but it is possible to configure the system to automatically retrieve data from all types of accounting systems and even from the tables.
KPI Suite has its own interface for data collection and consolidation. The input interface is supplied with the initial data from the accounting system or a table. Next, “binding” of external data with system objects is set.
Additional features of the system
Often, on the basis of these indicators, you need to automatically generate tabular reports. Moreover, the rules of reporting can be arbitrary. The system has a built-in capability of forming such arbitrary tabular reports by using this software. Figure 9 shows an example of the report in terms of net income, which is displayed in a single tabular report for all the branches of the bank. To do so, the report was formed as a little script that automatically searches all the necessary data structures in the system and enters them into the report line by line. The final report may be “flat” or hierarchical (in this example).
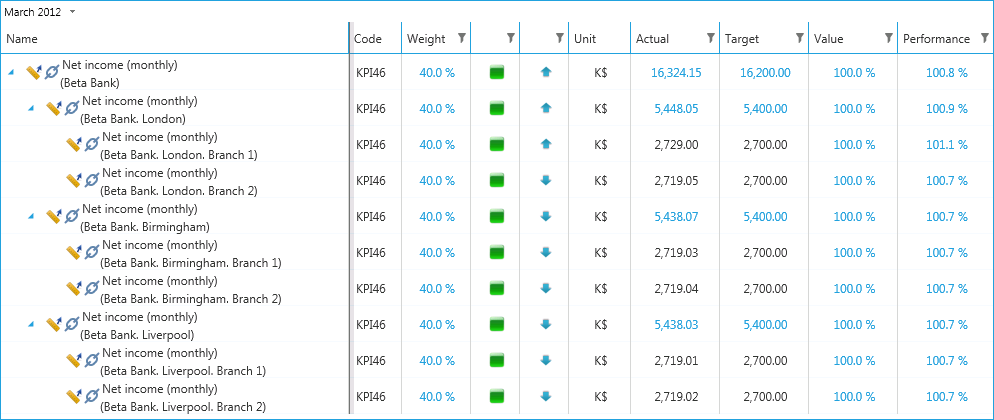
Fig. 9. Report with KPI Net income in the context of all bank branches.
This mechanism can also be used, to automatically generate bonus cards in the motivation system for the employees of the bank. Examples of bonus cards described in more detail in the Balanced Scorecard (BSC) solution.