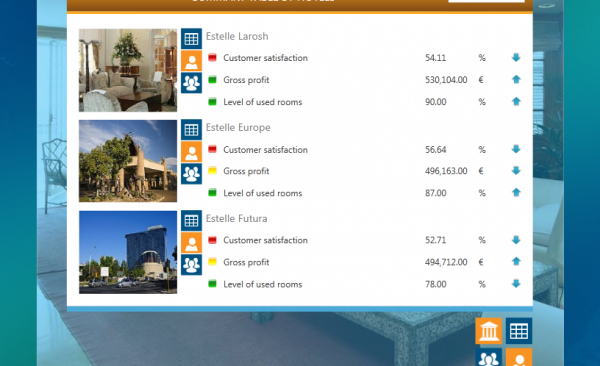
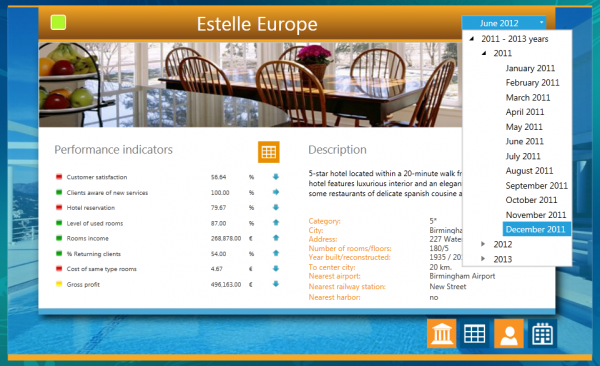
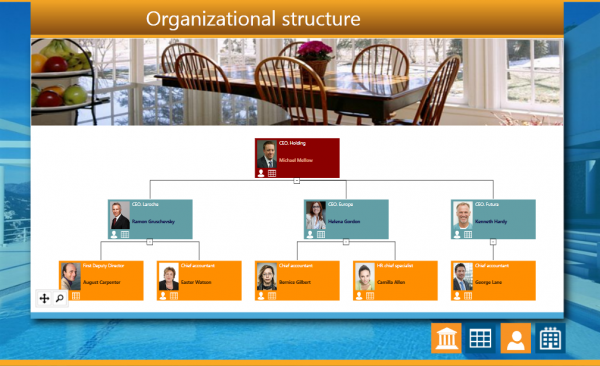
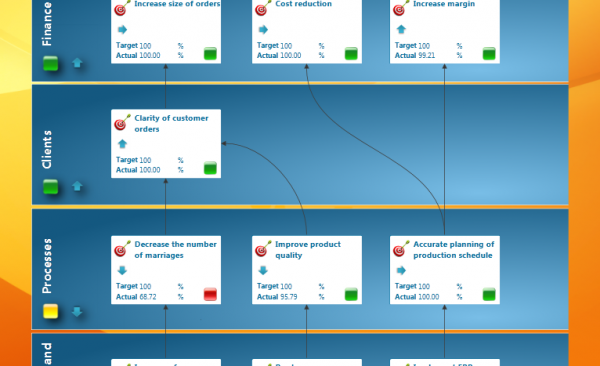
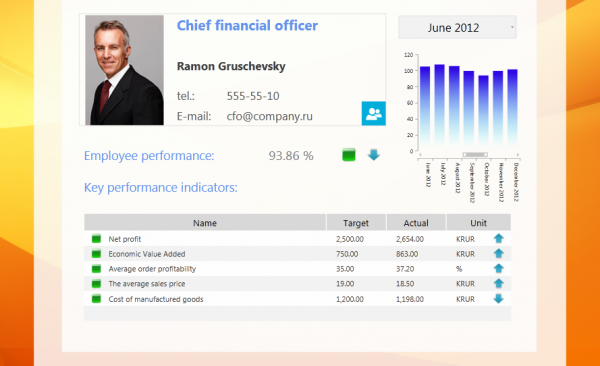
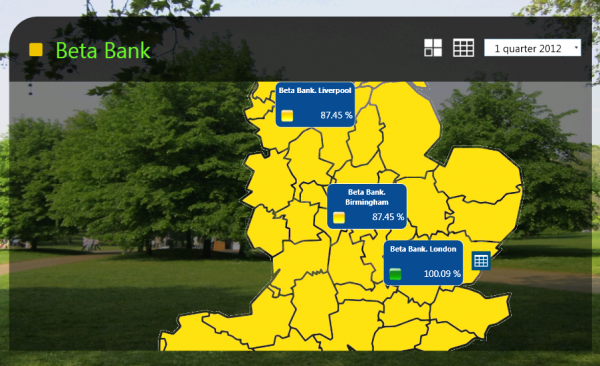
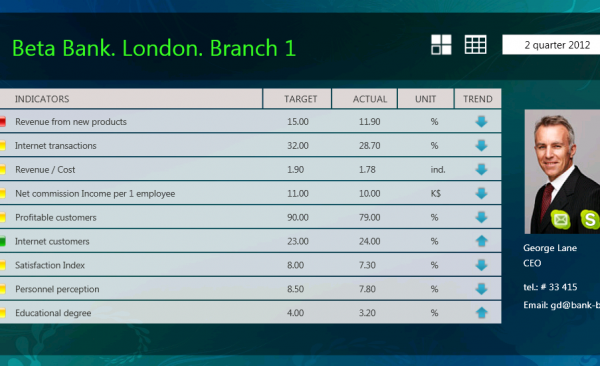
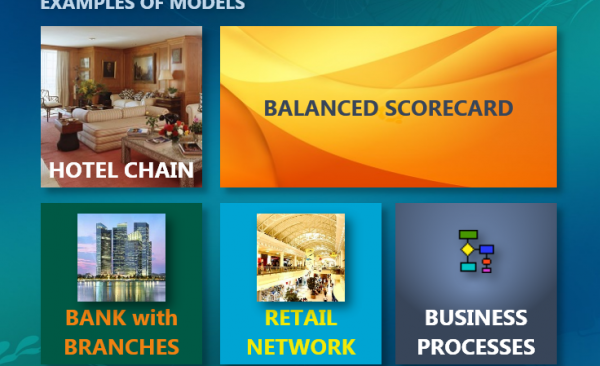
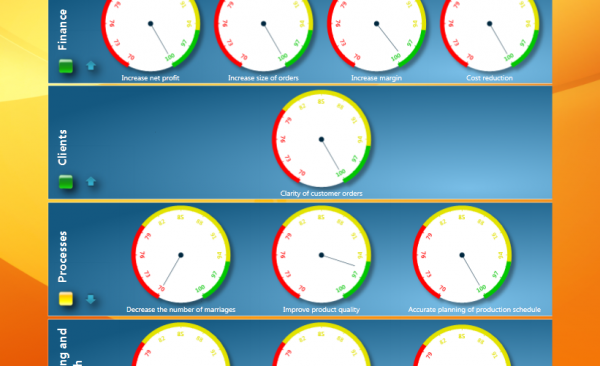
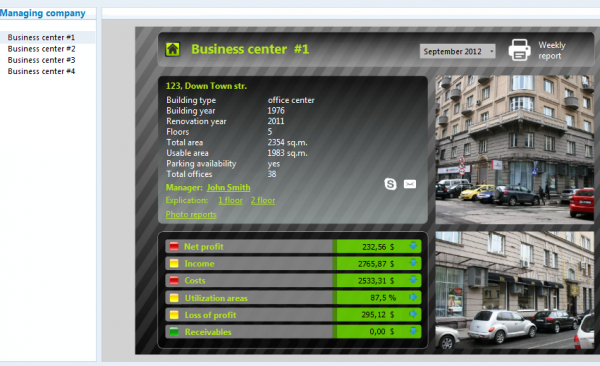
CREATING PERSONAL DASHBOARDS AND INTERFACES
- Visual building of interfaces and dashboards
- Application of corporate graphics
- Creating navigation links between interfaces
- Access restriction to interfaces and data
- Presentation of initial and calculated data
- Data output in tabular form with a hierarchy
- Using various filters according to periods: a year, half-year, quarter, month, etc.
- Ability to create orders and tasks in relation to indicators
- Circular, pie charts
- Bar chart, zone chart, scatter
- Heat maps for risk management models
- Gantt chart for project management
- Ability to input text as well as numeric data
- Formatted input of dates
- Using value of the directories
- Check boxes and multiple choice
INTERFACES AND DASHBOARDS
REQUEST FREE DEMO ACCESS

