
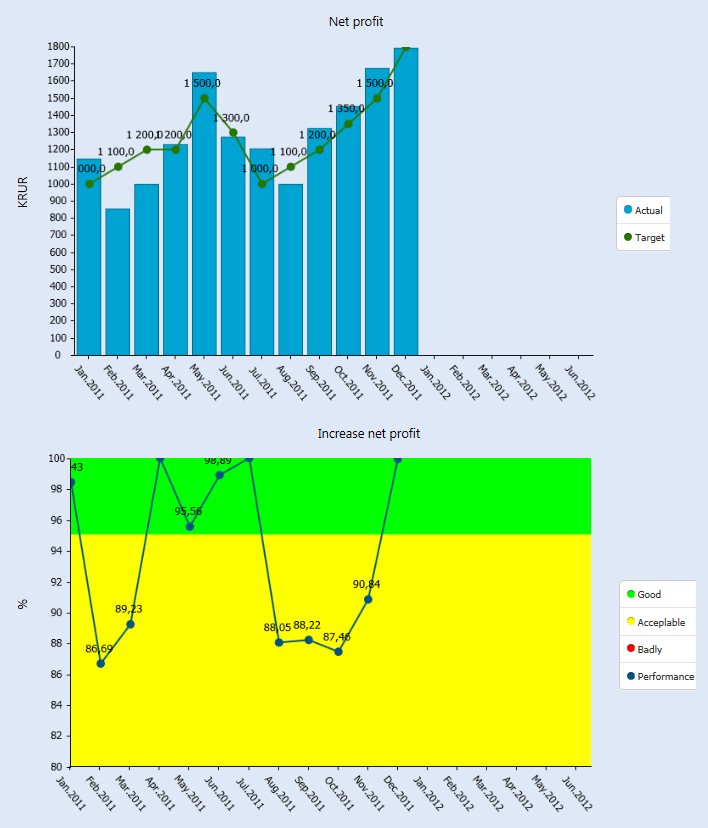
Charts are already displayed on the Dashboard in HTML. There were some difficulties in development because the components for SilverLight platform and Ext JS have had a lot of differences in the properties. The Charts are often using to display on the graphical cards (Dashboard of KPI) the dynamic of changes in values of the KPI.