

The main tasks of the hotel chain are the fulfillment of plans for profit, and the targets for the growth and development of the network.
In the “Managing a hotel chain” solution basic criteria for assessing the effectiveness of hotel chains are the following:
- Occupancy
- The dynamics of income and expenses
- Customer Satisfaction
- Quality of Service
- etc.
A set of evaluation criteria may vary depending on the goals and objectives of a particular hotel chain.
This solution shows how a system can be implemented and includes pre-configured components to build a model for the entire network, to bring key indicators and relate them to the management of the hotels.
In other words, the manager will always be informed about the status of a particular hotel in the chain, and will always have the latest information for decision-though the Internet.
The work begins on home page with the links to the main interfaces with key performance indicators (KPI), necessary documents, reports, etc.

Fig. 1. Home page of the hotel chains management system on KPi Suite.
There is dashboard for the management that reflects the summary information and key performance indicators for all hotels in the chain. This can be implemented in the form of a map indicating the location of the hotels.
Each hotel also has average weighted performance evaluation, calculated on the basis of the plan for each core indicator (KPI). The overall performance assessment can also be displayed graphically.
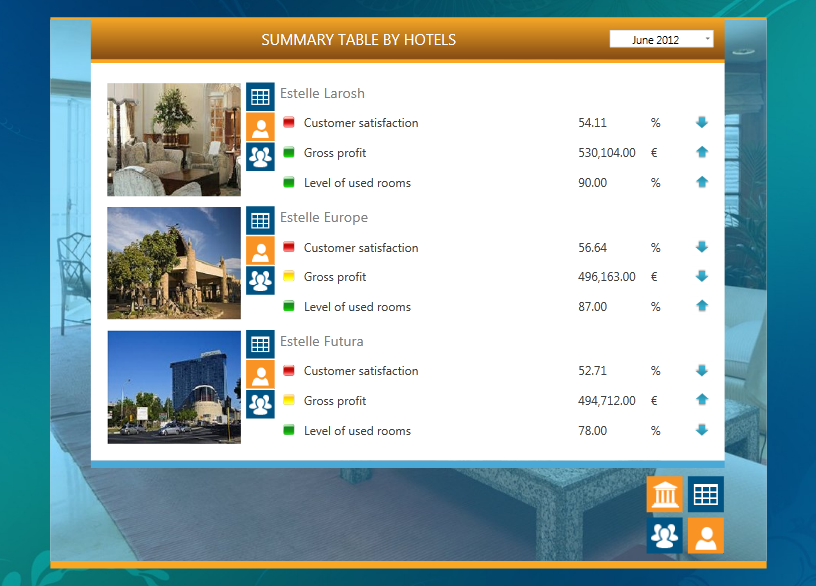
Fig. 2. Consolidated view with main KPIs of all hotels.
Clicking on the selected hotel, you can go to a hotel card with already displayed key indicators of the chosen hotel. You can select the evaluating period (in the upper right corner of the card) and recognize correct data for this period.
The system allows you to store not only data indicators, and may also reflect any descriptive information of the hotel. In the example below it is displayed in the “Description” field.
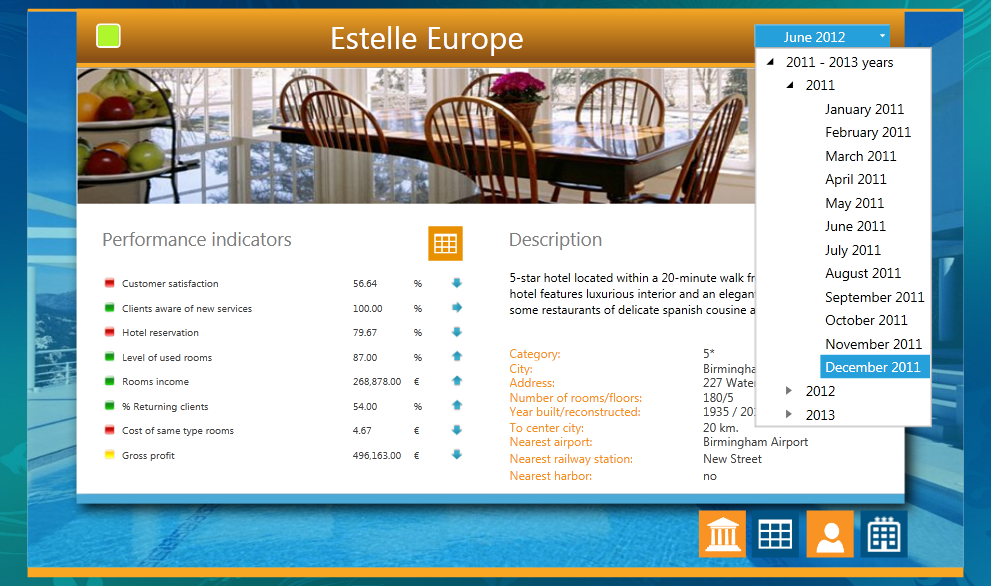
Fig. 3. Dashboard of the hotel with the main KPIs.
Each Head of the hotel is responsible for the hotel’s performance, and his work is evaluated by the fulfillment of all key performance indicators (KPI).
The system allows you to display graphically the organizational structure of the hotel chain as a whole, as well as subordinates for each hotel. The following is a simplified example of the organizational structure. By clicking on a selected employee in the organizational structure, you can go to his card displaying his KPIs.
The KPIs are decomposed down from the level of the hotel to each manager. At the top level the KPIs can also be collected (summed) and displayed in the card of the hotel.
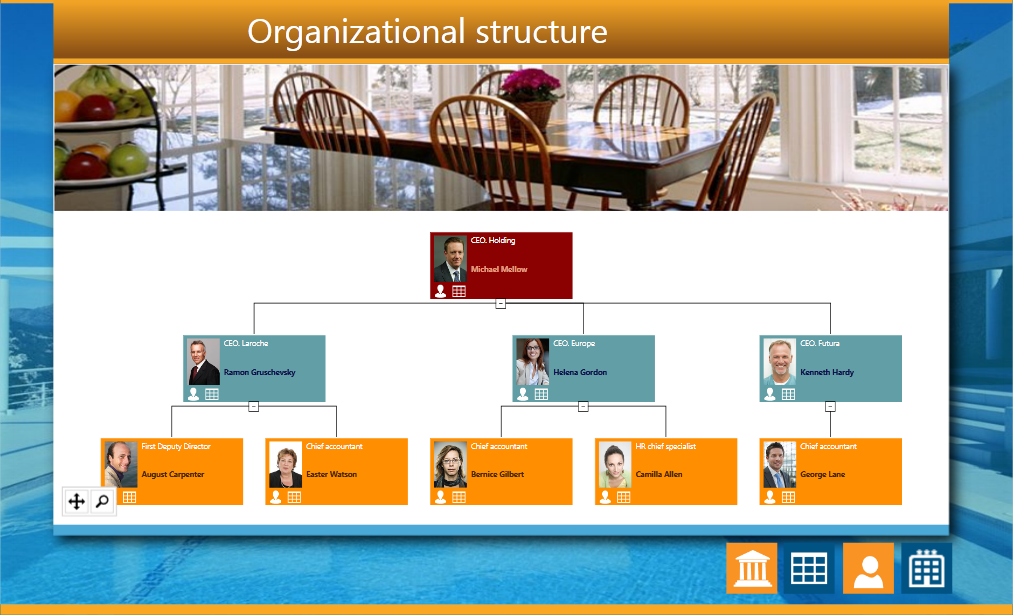
Fig. 4. The organizational structure of the company managing the hotel chain.
Together with the organizational structure the system allows you to create summary cards for the employees. They may contain the key managers of the hotel with the results of their work in figures, or reflect the performance of managers and fulfillment of the main KPIs of the hotel.
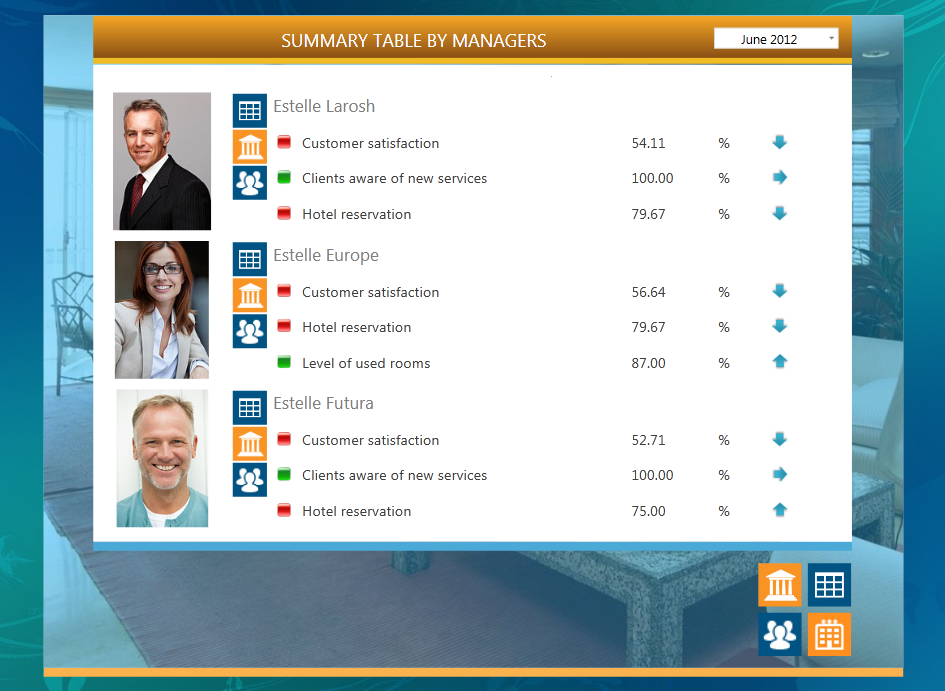
Fig. 5. Consolidated dashboard with managers of hotel chain.
The examples of the graphical interfaces below show already calculated results.
Let us consider how the results were obtained.
Below there is a data structure with the KPIs of a hotel. Indicators can receive data automatically from the accounting systems, or the data can be entered manually if you have a permission to enter data.
Some indicators, like “Customer Satisfaction” are considered as a percentage based on the data in the subsidiary indicators. In the example in Picture 6 two indicators “% positive feedback” and “% negative reviews” have calculated % of implementation within. Finally the customer satisfaction is calculated as: “% positive feedback” * weight index + “% negative reviews” * weight indicator.
Evaluation of each indicator is displayed as a percentage and considers over-fulfillment or under-performance of indicator. For example, if the rate is exceeded and the “% Complete”> 100%, the assessment is equal to 100%. If the indicator is not fulfilled, then the rating is 0%.
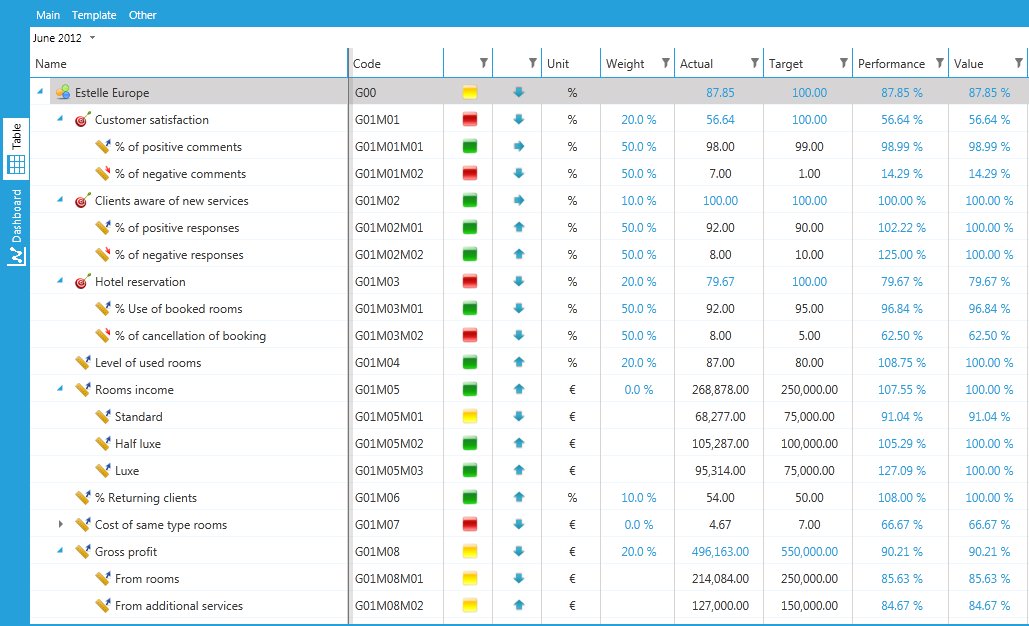
Fig. 6. The data structure with KPIs of the hotel.
The spreadsheet above displays the combined Indicators for the entire hotel chain. Each indicator is decomposed into components that are “lifted up” from each hotel. In the example below the decomposition of the indicators” Rooms occupancy level” and “Rooms gross profit is shown”.
“Rooms occupancy level” contains the calculated average occupancy rate for the entire hotel chain. In its calculation formula the average value of the subsidiary indicators (levels of occupancy of rooms at the hotel) is included.
In case of Gross Profit it is seen that the total gross profit of the chain is obtained by summing the gross profit earned by each hotel.
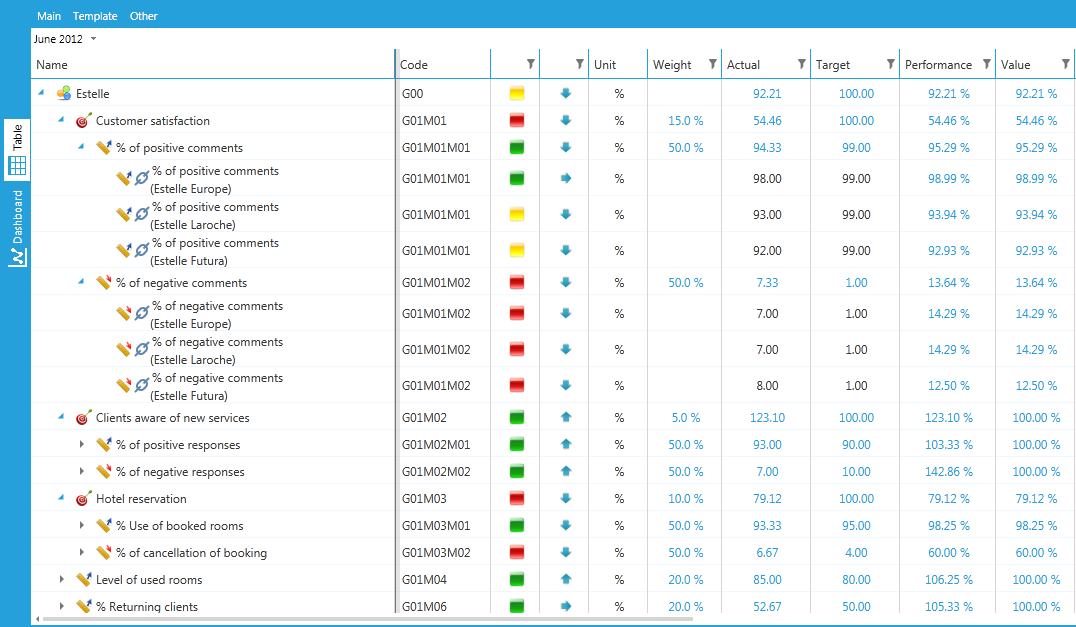
Fig. 7. The data structure with all KPIs of the hotel chain.
The given solution shows how to calculate and display the data of the hotel chain. Each project can have much more indicators and their calculations may be different. But the principle of the model will not change. Thus, this solution can be used as a template for rapid implementation of the performance evaluation system for the hotel chains and needs only to be filled with the necessary parameters and information about hotels and employees.