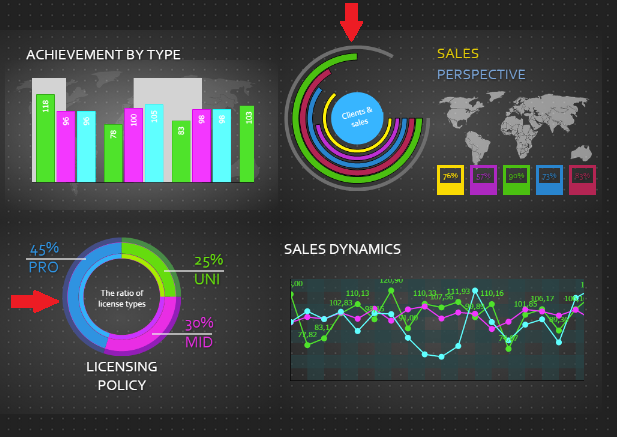
We had much hard work with creating “Speedometer” in the HTML because we did not find ready-made components with the same features like in MS SilverLight. In the result we had created the own component “from scratch”, which repeats the behavior of its “big brother”.
GANTT CHART IN HTML
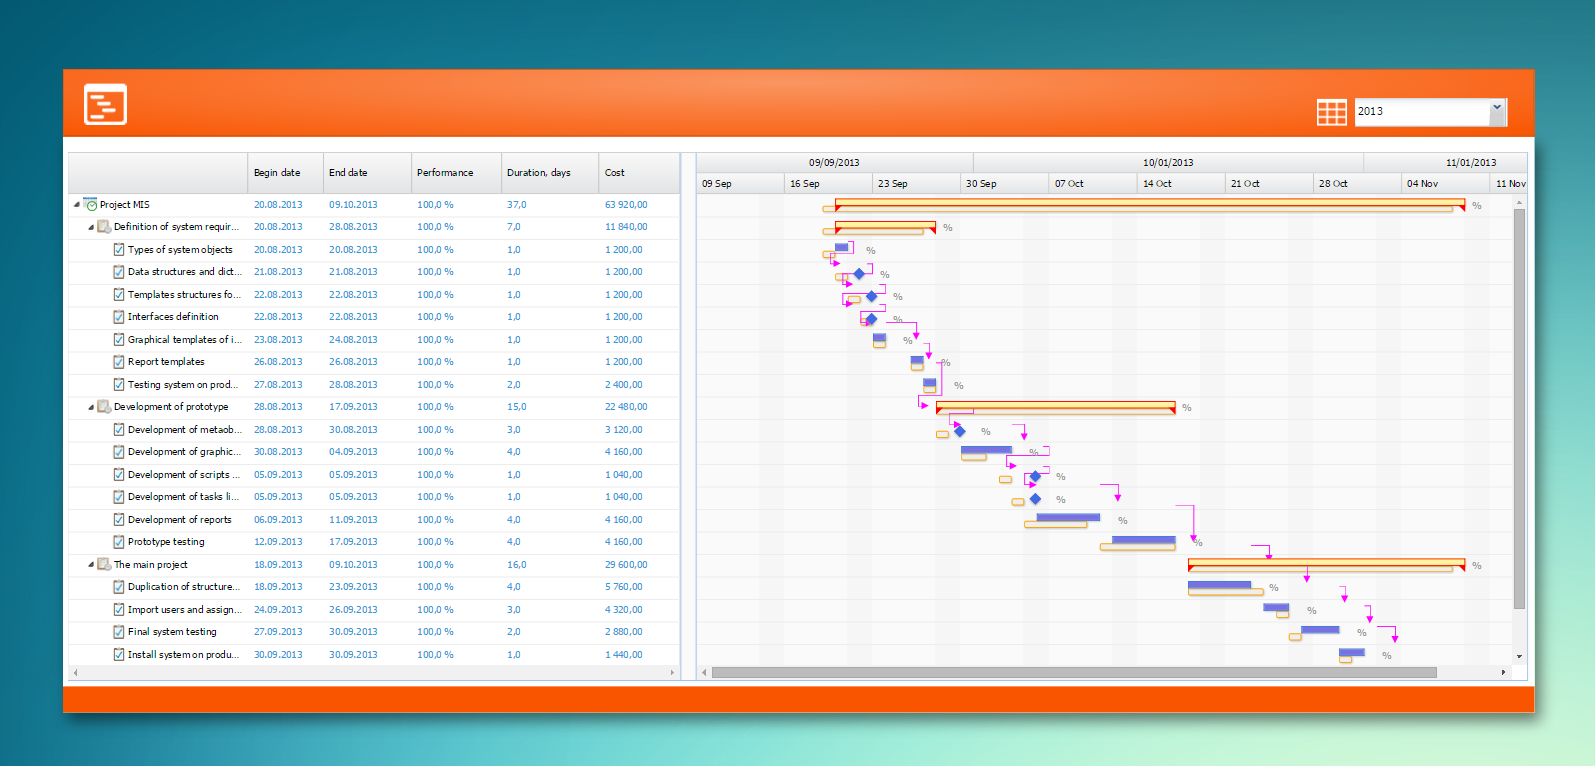
Today was implemented displaying of Gantt Chart on the Dashboard in the HTML client. The appearance is a little different from version of the Gantt Chart on MS Silverlight, but the basic parameters are processed and output content is same like original.
Now we need to implement graphical hierarchy of objects and indicators (speedometers) in the HTML. After that we can then proceed to full-scale testing of the HTML client.
PIE CHARTS IN HTML

We quite quick have implemented the Pie Charts and “Donuts” for HTML Dashboards. Data is loading from the data structures of KPI model as usual.
CHARTS IN HTML
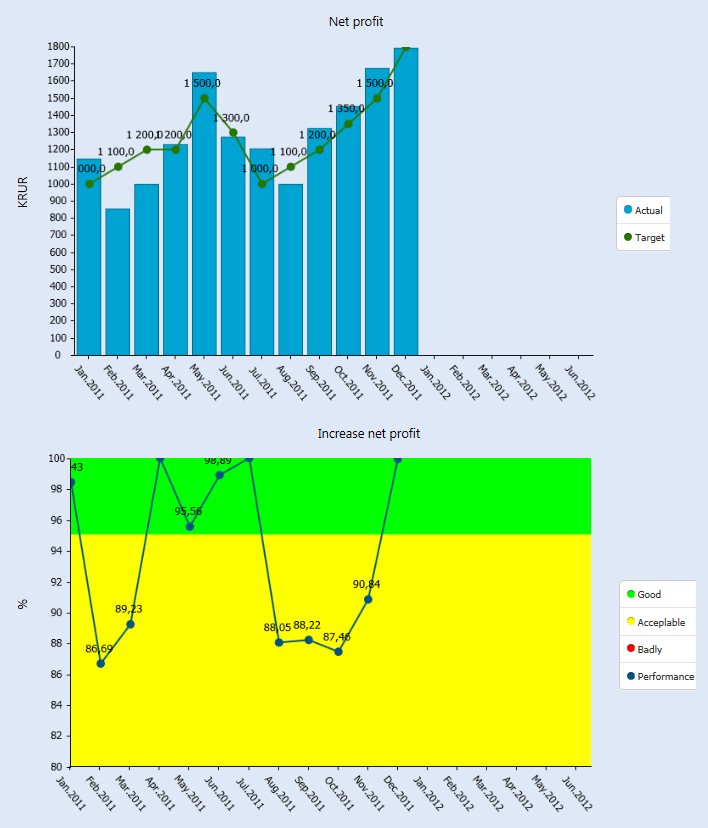
Charts are already displayed on the Dashboard in HTML. There were some difficulties in development because the components for SilverLight platform and Ext JS have had a lot of differences in the properties. The Charts are often using to display on the graphical cards (Dashboard of KPI) the dynamic of changes in values of the KPI.
FILE BROWSER IN HTML
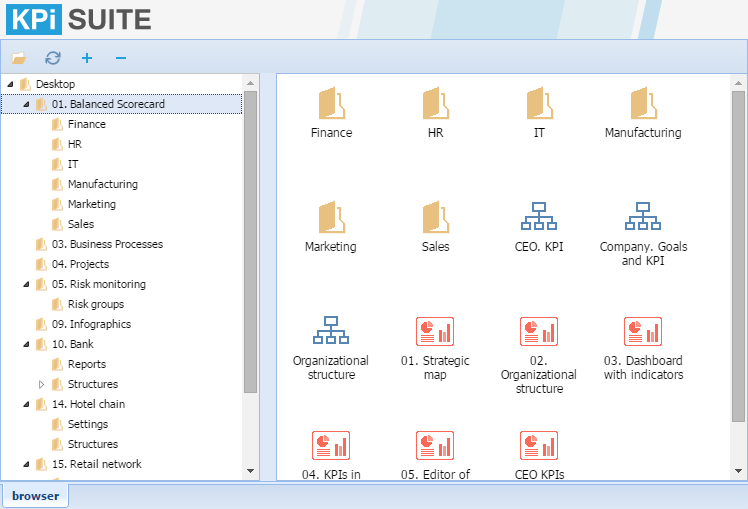
Browser is working. There are files which can be opened in the HTML client. Now we are testing working of the system on smartphones, tablets and PC. Files’ navigation on the smartphone is complicated due to the small screen, but working is stable. It is necessary to train the fingers 🙂
We remind you that in the HTML version of the system will be available viewing and editing the values of the elements (KPI, risks, projects, processes) of data structures, viewing the Dashboards, documents and more.
THE GEOMETRY OF THE ELEMENTS IN HTML
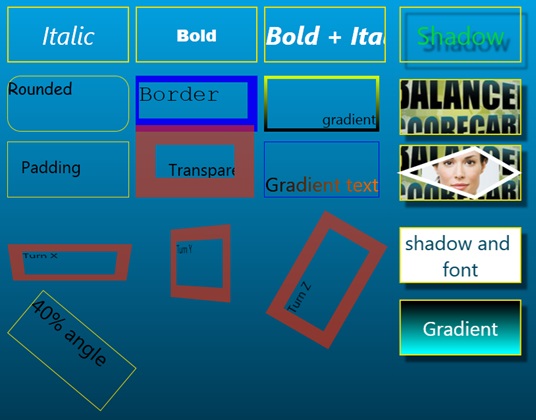
Working on Text elements convert. Checking and reviewing the geometry and main parameters. Values are loaded from the data structures. Already some of demo Dashboards are beginning to appear in html correctly.
VECTORS IN HTML
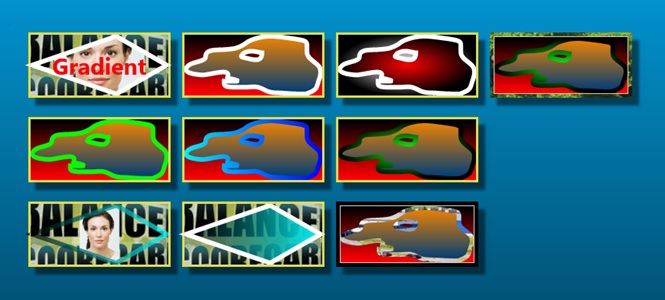
Testing the different versions of vectors in html. We need properly convert vectors from Silverlight elements to HTML otherwise Dashboard will not be same like original. Elements with custom shapes which were created using path can be showed with a gradient, picture in the background and with simple solid color. Transparency and shadows properties also saved.
Editing data in Dashboard
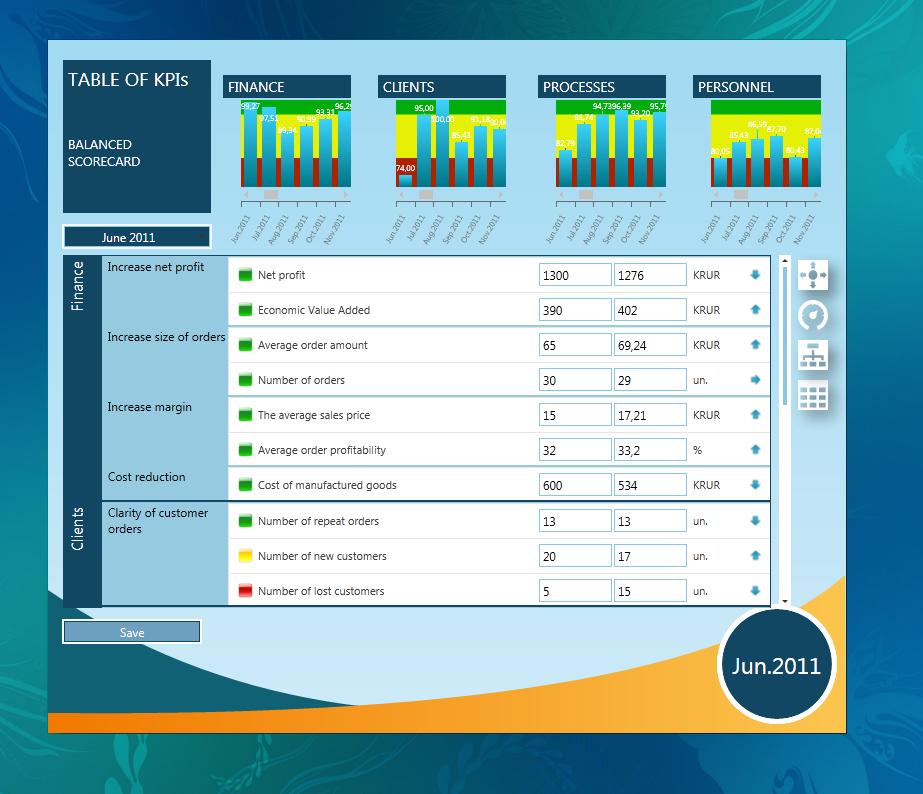
Finally taught dashboards to enter data of KPI’s and fill up the tables. Now, there is no need to open each timetable to change or add values. As in simple HTML opens a dashboard, values are added to the text box and then it is saved. The system will transfer calculation data and load new values into the dashboard.

